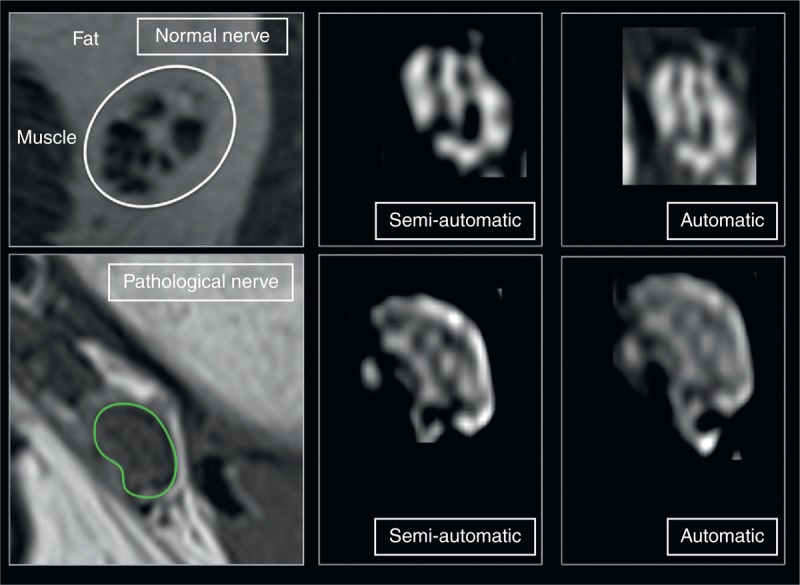
FIGURE 2.

Quantitative analysis of FR. Regions of interest were drawn around the epineurial contour of peripheral nerves in axial T1-weighted images (green line). Quantitative analysis was performed on every slice, extremes excluded. On MRI images, the software, after threshold identification, differentiated the fascicles (hypointense on T1-weighted sequences) and the perifascicular tissue (hyperintense on T1-weighted sequences) that resembles the signal of fat. The FR was calculated based on the volume of the fascicles in relation to the total volume of the nerve. The pathological nerve is a tibial nerve. The results are reported in the text and tables. FR = fascicular ratio, MRI = magnetic resonance imaging.
