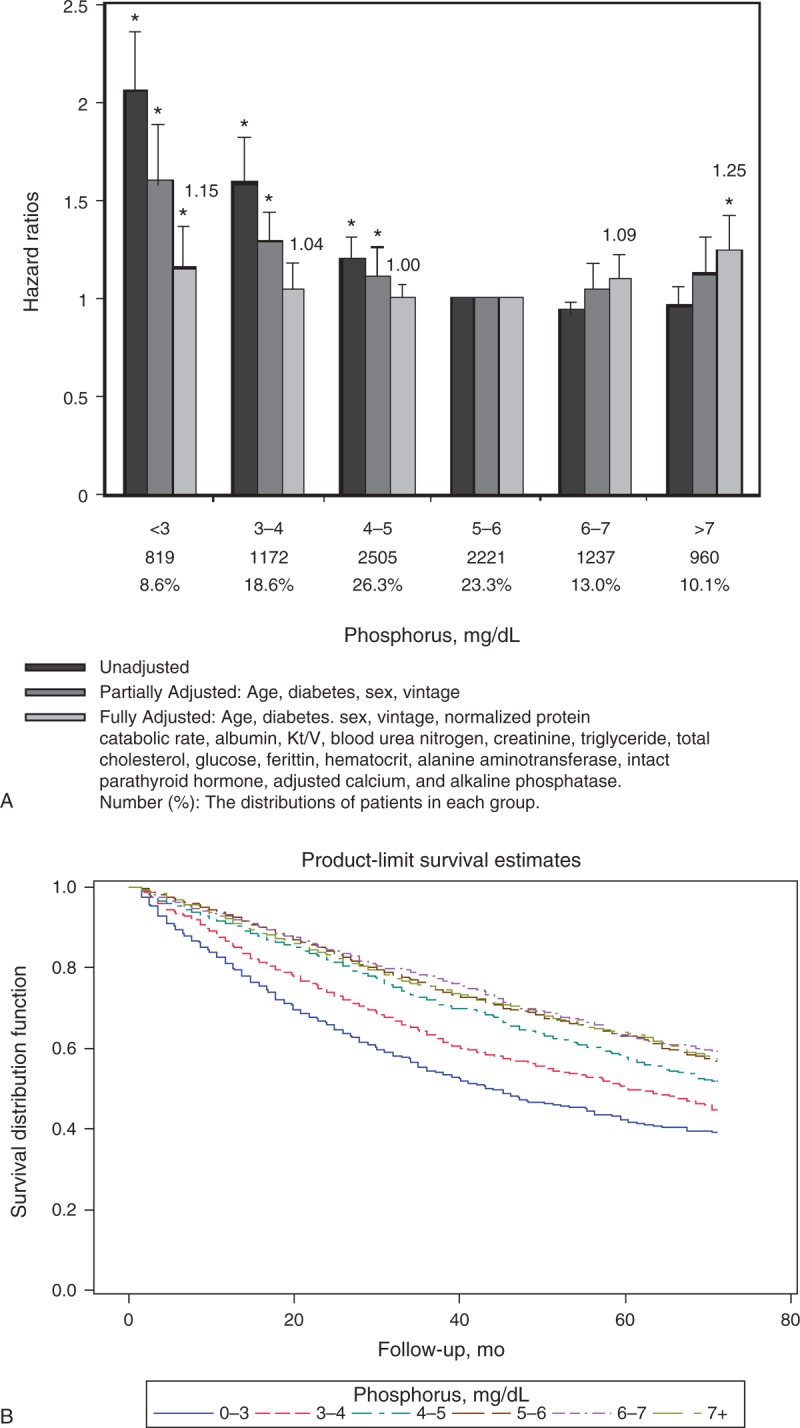
FIGURE 2.

(A) Unadjusted, partially adjusted, and fully adjusted HRs of all-cause mortality across different categories of serum phosphorus levels in 9514 patients MHD during 30,363 person-years of follow-up. The lowest HR group (5 mg/dL ≤ phosphorus < 6 mg/dL) serves as the reference group. Note that the association between hyperphosphatemia and mortality was not significant until multivariate adjustments were made. (B) Kaplan–Meier survival curves among patients with different categories of serum phosphorus levels. HR = hazard ratio, MHD = maintenance hemodialysis.
