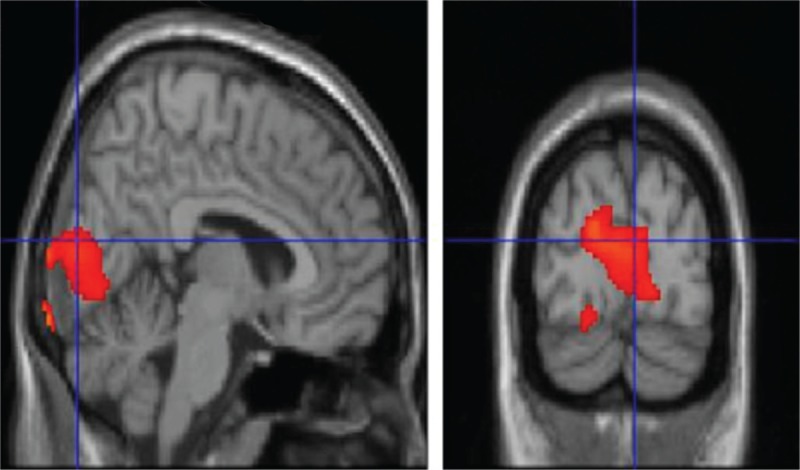
FIGURE 1.

T1 MRI superimposition showing the cluster of voxels in the cuneus, lingual gyrus, and parahippocampal gyrus, mainly in the left hemisphere, in which FDG uptake was significantly higher at OC (n = 26) as compared to NC (n = 26) (on the left sagittal and on the right coronal projections). Coordinates and regional details are presented in Table 1. FDG = 18F fluorodeoxyglucose, MRI = magnetic resonance imaging, NC = neutral olfactory condition, OC = pure olfactory condition.
