
FIGURE 2.
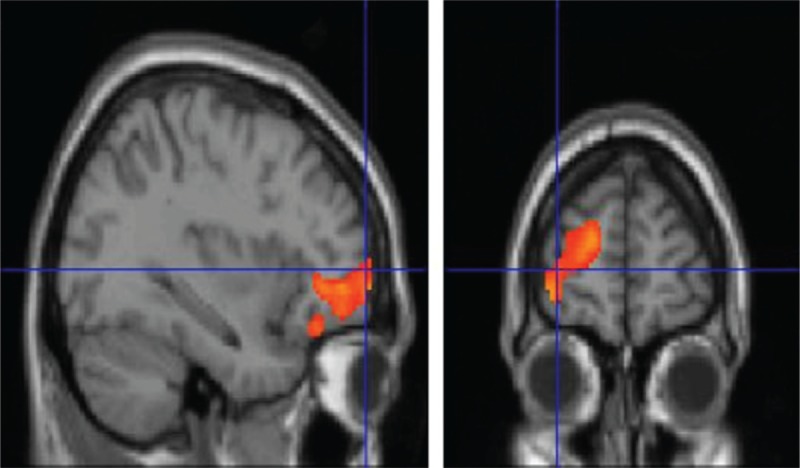
T1 MRI superimposition showing the cluster of voxels in the left orbitofrontal and anterior cingulate cortex in which FDG uptake was significantly higher at NC (n = 26) as compared to OC (n = 26) (on the left sagittal and on the right coronal projections). Coordinates and regional details are presented in Table 2. FDG = 18F fluorodeoxyglucose, MRI = magnetic resonance imaging, NC = neutral olfactory condition, OC = pure olfactory condition.