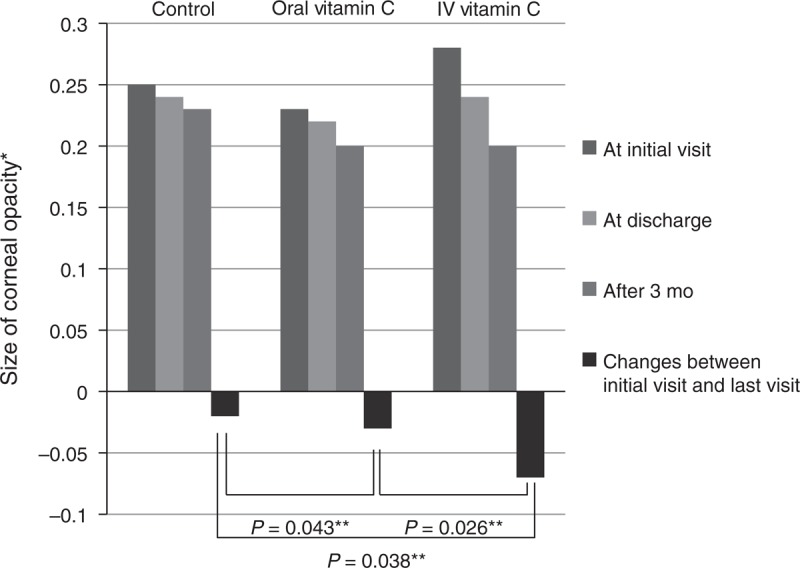
FIGURE 2.

Comparison of the size of corneal opacity. This histogram shows that the size of the corneal opacity in all groups decreased 3 months after discharge compared with the size at the initial visit. The reductions were significantly greater in the oral and intravenous vitamin C treatment groups than in the control group. The reduction in corneal opacity size was significantly greater in the intravenous vitamin C treatment group than in the oral vitamin C group. IV = intravenous. *Measured opacity size divided by the size of the whole cornea. **Repeated measures analysis of variance.
