
FIGURE 3.
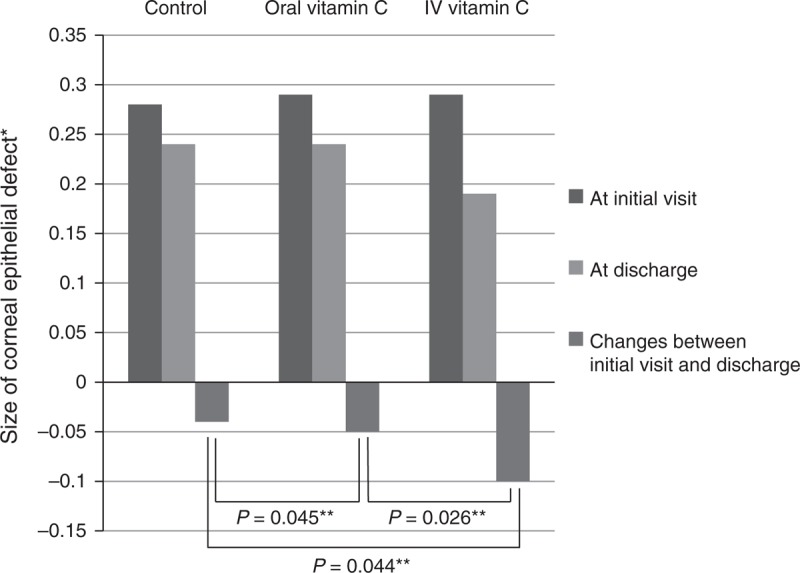
Comparison of size of corneal epithelial defect. This histogram reveals that the size of the epithelial defect decreased in all groups at hospital discharge compared with the size at the initial visit. The changes in epithelial defect size were significantly greater in the oral and intravenous vitamin C groups than in the control group. The reduction in the epithelial defect size was also significantly greater in the intravenous vitamin C group than in the oral vitamin C group. IV = intravenous. *Measured epithelial defect size divided by the size of the whole cornea. **Repeated measures analysis of variance.