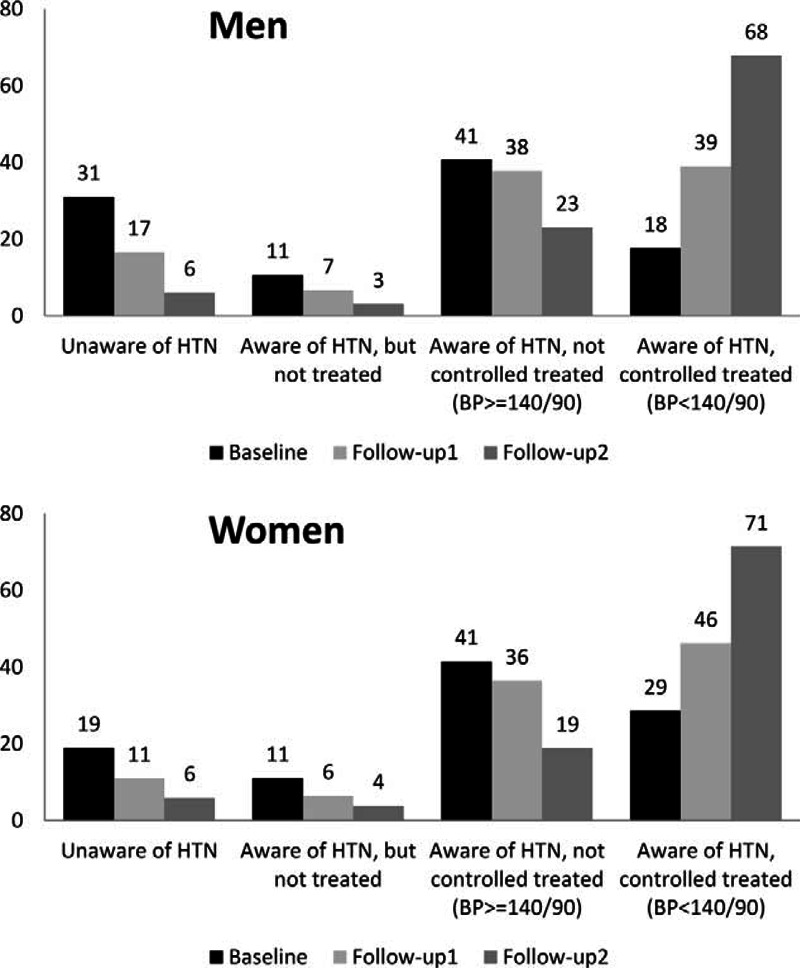
FIGURE 4.

Changes in percentage of hypertension awareness among participants with hypertension at each study point, for men and women. Follow-up data were weighted for loss to follow-up. Baseline is represented by black balks, follow-up1 by light grey and follow-up2 by dark grey. BP = blood pressure, HTN = hypertension.
