
FIGURE 2.
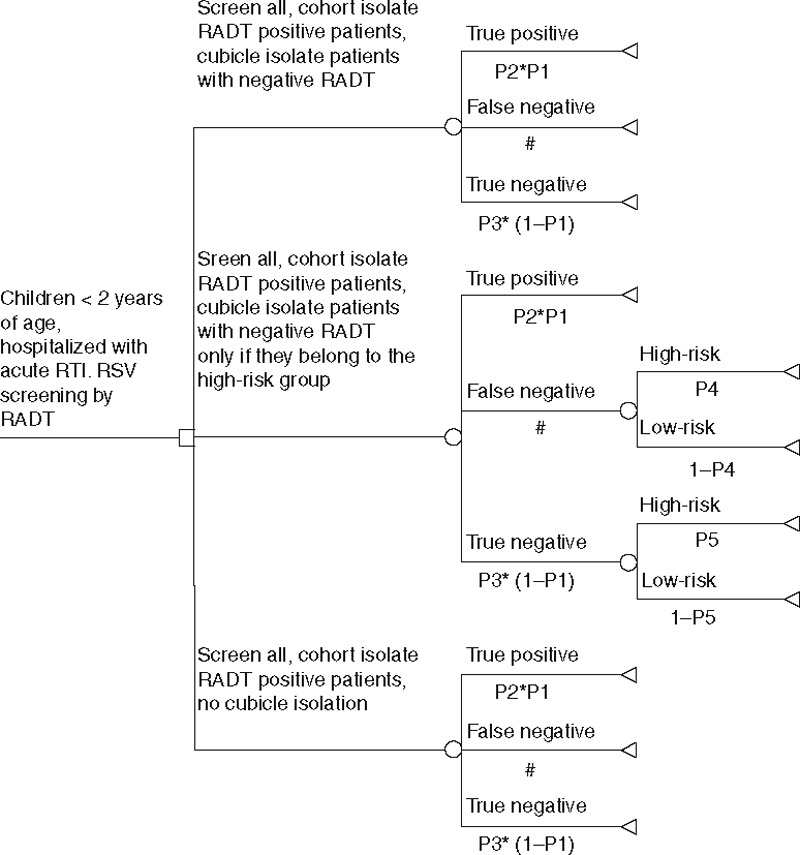
Decision analytical model. The decision tree illustrates 3 different isolation strategies and respective transition probabilities according to the data provided in Table 4.
Official websites use .gov
A
.gov website belongs to an official
government organization in the United States.
Secure .gov websites use HTTPS
A lock (
) or https:// means you've safely
connected to the .gov website. Share sensitive
information only on official, secure websites.
Decision analytical model. The decision tree illustrates 3 different isolation strategies and respective transition probabilities according to the data provided in Table 4.