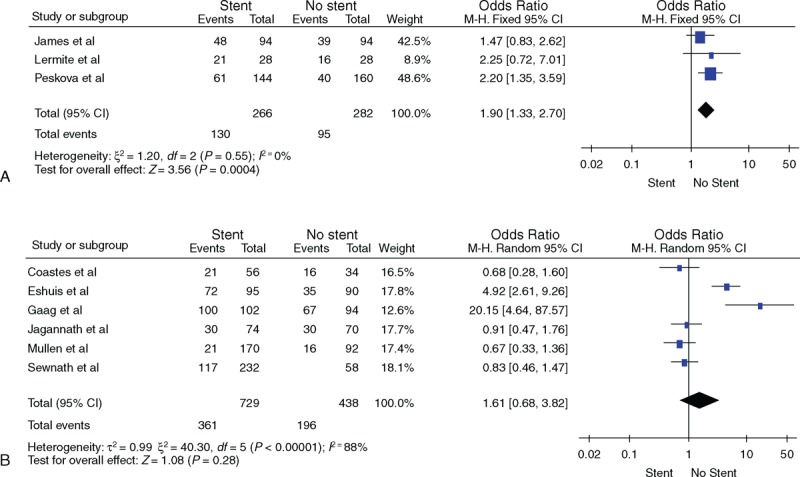
FIGURE 3.

(A) Comparison of total morbidity between the nondrainage and drainage groups with drainage times <4 weeks. (B) Comparison of total morbidity between the nondrainage and drainage groups with drainage time >4 weeks.

(A) Comparison of total morbidity between the nondrainage and drainage groups with drainage times <4 weeks. (B) Comparison of total morbidity between the nondrainage and drainage groups with drainage time >4 weeks.