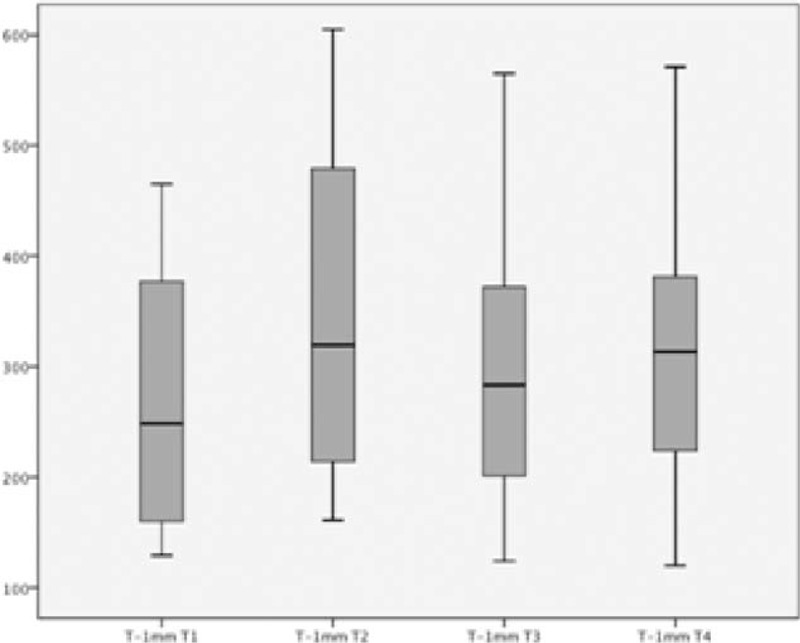
FIGURE 1.

Time to 1.0 mm ST-segment deviation in the 4 exercise tests. The first 2 tests were performed without the use of medications, and the last 2 tests (T3 and T4) were performed after 1 week of TMZ. The whiskers represent minimum and maximum data, and the middle lines represent median and interquartile range.
