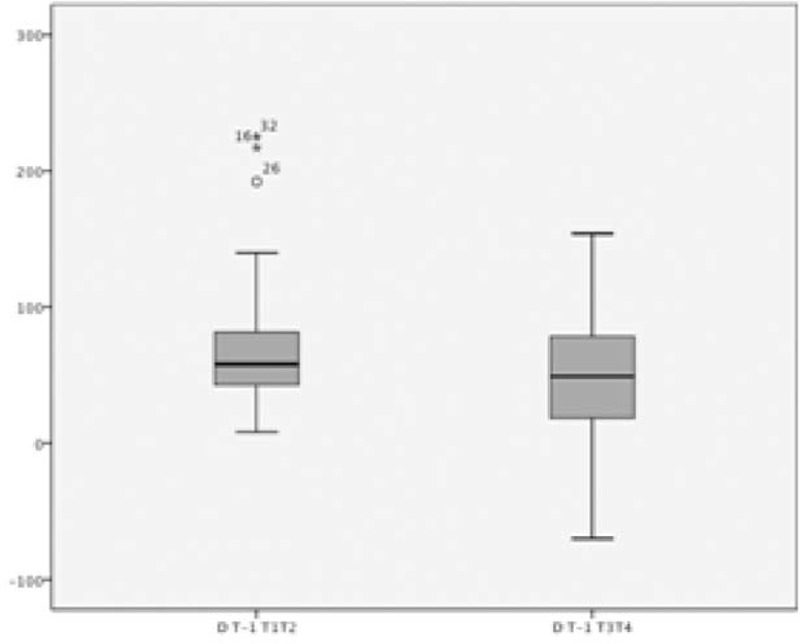
FIGURE 2.

Results of Delta 1 and Delta 2 of T-1.0 mm. Delta 1: variation between values of ET1 and ET2; Delta2: variation between values of ET3 and ET4. The whiskers represent minimum and maximum data, and the middle lines represent median and interquartile range. The stars and the small circle represent the outliers.
