
FIGURE 2.
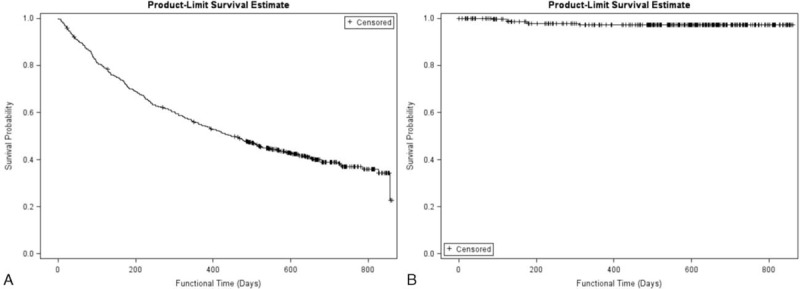
Function curves of implanted intravenous port. (A) Functional results of the implanted intravenous port in the whole population. Curve declined gradually because the patient died of cancer progress. (B) Functional results of the implanted intravenous port in patients still under surveillance. Curve declined slowly and high functional rate in alive oncology patients.