FIGURE 1.

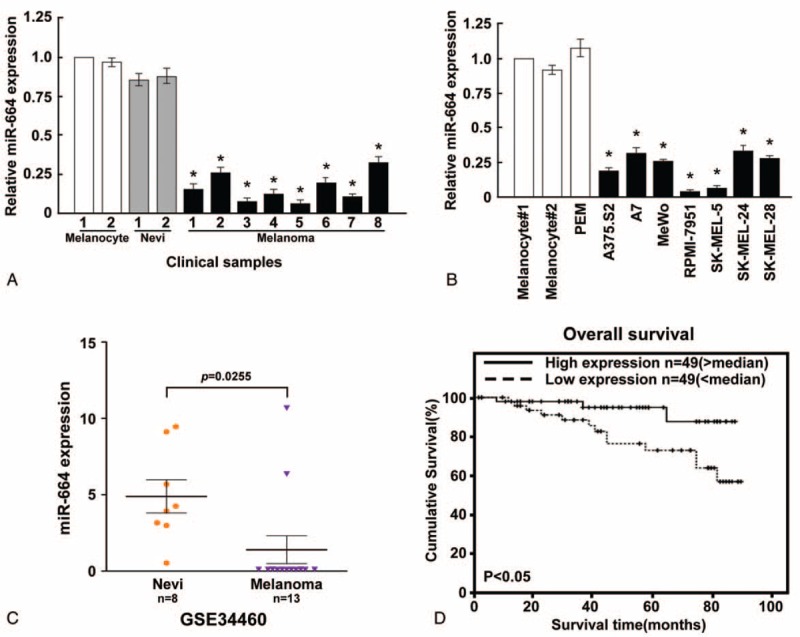
Expression analysis of microRNA (miR)-664 in CMM cell lines and tissues. (A) MiR-664 expression was examined in CMM, NHM, and BMN tissues. (B) Real-time PCR analysis of miR-664 expression in NHM tissues and CMM cell lines, including A375.S2, A7, MeWo, RPMI-7951, SK-MEL-5, SK-MEL-24, and SK-MEL-28. (C) Analysis of microarray data (accession number GSE334460) revealed miR-664 downregulation in 13 patients. (D) Correlation between miR-664 levels and survival by Kaplan–Meier analysis of patients with high (greater than the median; n = 49) or low miR-664 (less than the median; n = 49) expression. The average miR-664 expression was normalized by U6 expression. Each bar represents the mean of 3 independent experiments. ∗P < 0.05. BMN = benign melanocytic naevi, CMM = cutaneous malignant melanoma, NHM = normal human melanocytes, PCR = polymerase chain reaction.
