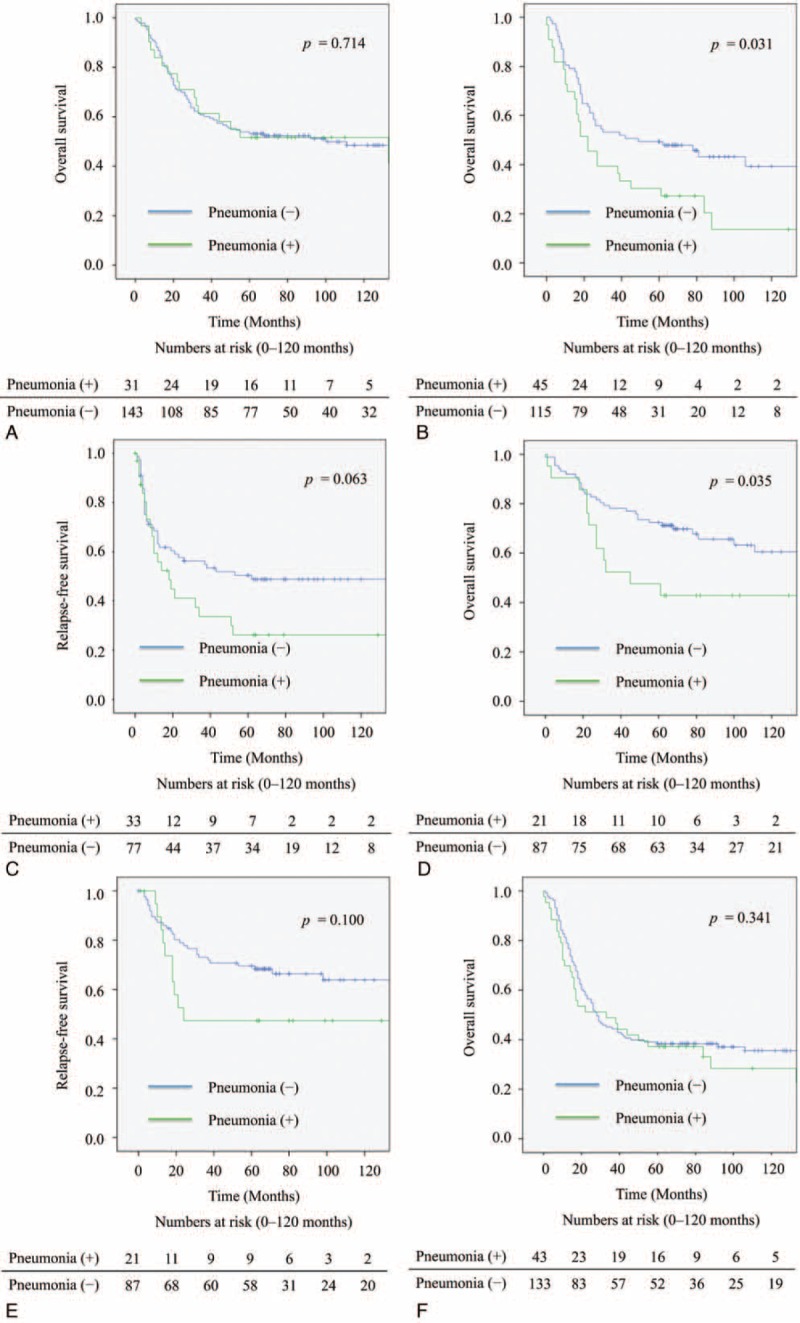
FIGURE 2.

Subgroup analyses of Kaplan–Meier survival curves for patients with or without pneumonia undergoing esophagectomy. A: Overall survival curves for the patients aged under 64. B: Overall survival curves for the patients aged over 65. C: Relapse-free survival curves for the patients aged over 65. D: Overall survival curves for the patients in cStage I. E: Relapse-free survival curves for the patients in cStage I. F: Overall survival curves for the patients in cStage II/III/IV.
