
FIGURE 1.
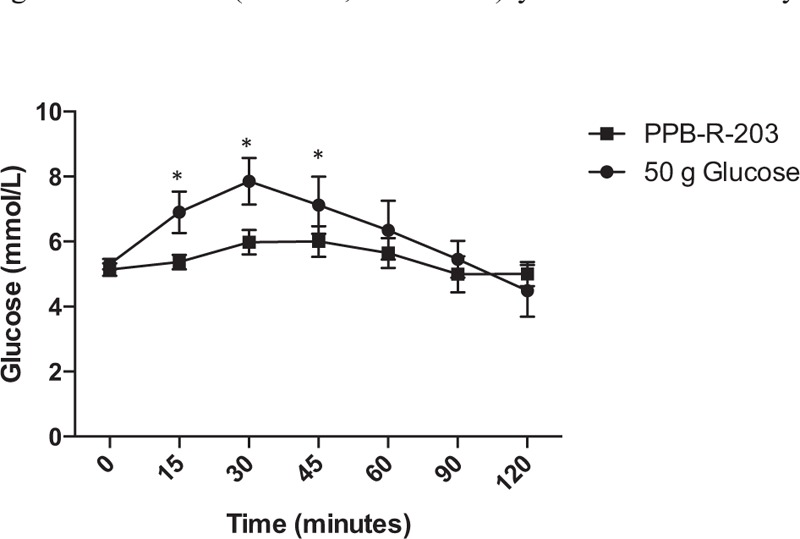
Glycemic response to PPB-R-203 compared with 50-g glucose in healthy participants. Data are represented as mean ± 95% confidence intervals. ∗Significant difference at matched time point (P < 0.05, based on Student t test).
Official websites use .gov
A
.gov website belongs to an official
government organization in the United States.
Secure .gov websites use HTTPS
A lock (
) or https:// means you've safely
connected to the .gov website. Share sensitive
information only on official, secure websites.
Glycemic response to PPB-R-203 compared with 50-g glucose in healthy participants. Data are represented as mean ± 95% confidence intervals. ∗Significant difference at matched time point (P < 0.05, based on Student t test).