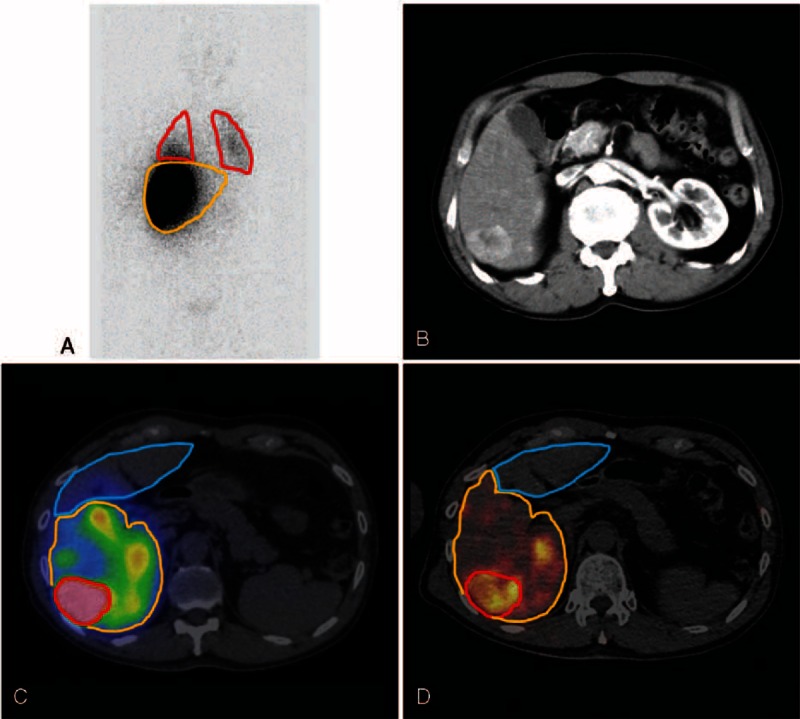
FIGURE 1.

ROIs and VOIs for image analysis. LSF was measured on anterior and posterior 99mTc-MAA planar scans. ROIs are drawn on the lungs (red) and liver (yellow) (A). With reference to contrast-enhanced CT images (B), VOIs for 3 partitions of tumor (red), in-target normal liver (yellow), and out-target normal liver (blue) were drawn on 99mTc-MAA SPECT/CT (C) and 90Y-microsphere PET/CT (D).
