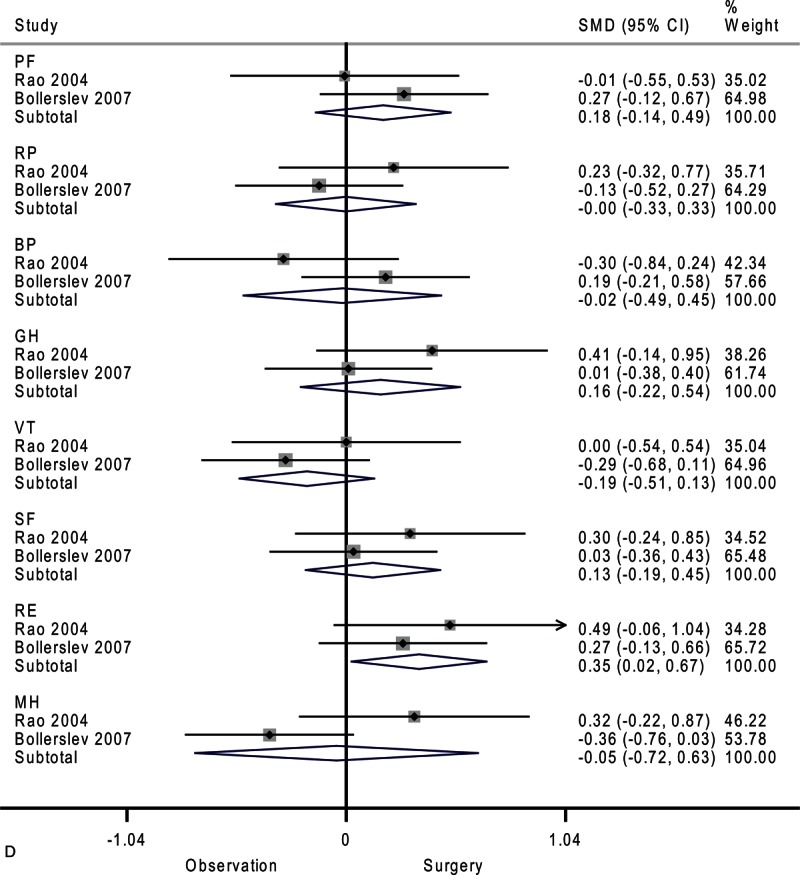
FIGURE 2 (Continued).

Forest plots showing standardized mean difference and 95% confidence intervals of the Short Form-36 general health survey between surgery and surveillance groups at baseline (A), 6 months (B), 12 months (C), and 24 months (D). The diamonds represent the overall pooled estimate.
