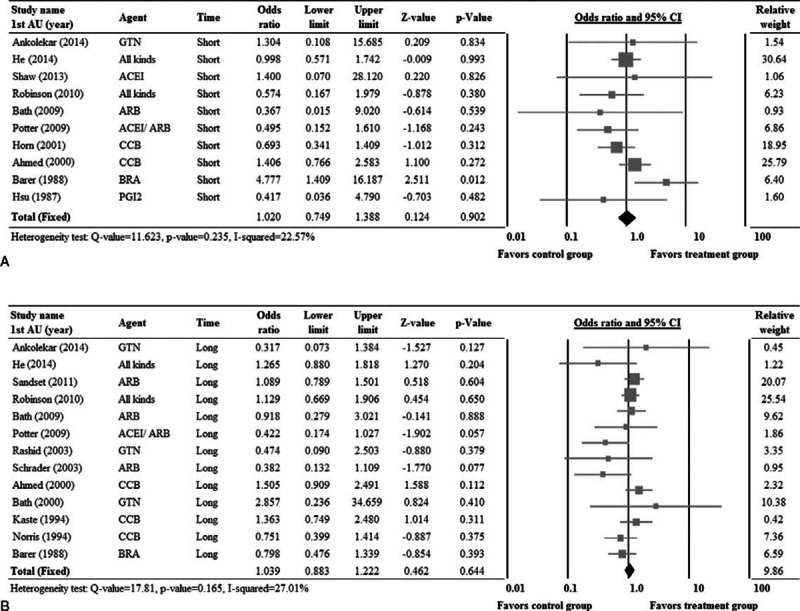
FIGURE 4.

Forest plots of the rates of short-term (A) and long-term (B) mortality compared between patients that received treatment and controls. 1st AU = first author; CI = confidence interval.

Forest plots of the rates of short-term (A) and long-term (B) mortality compared between patients that received treatment and controls. 1st AU = first author; CI = confidence interval.