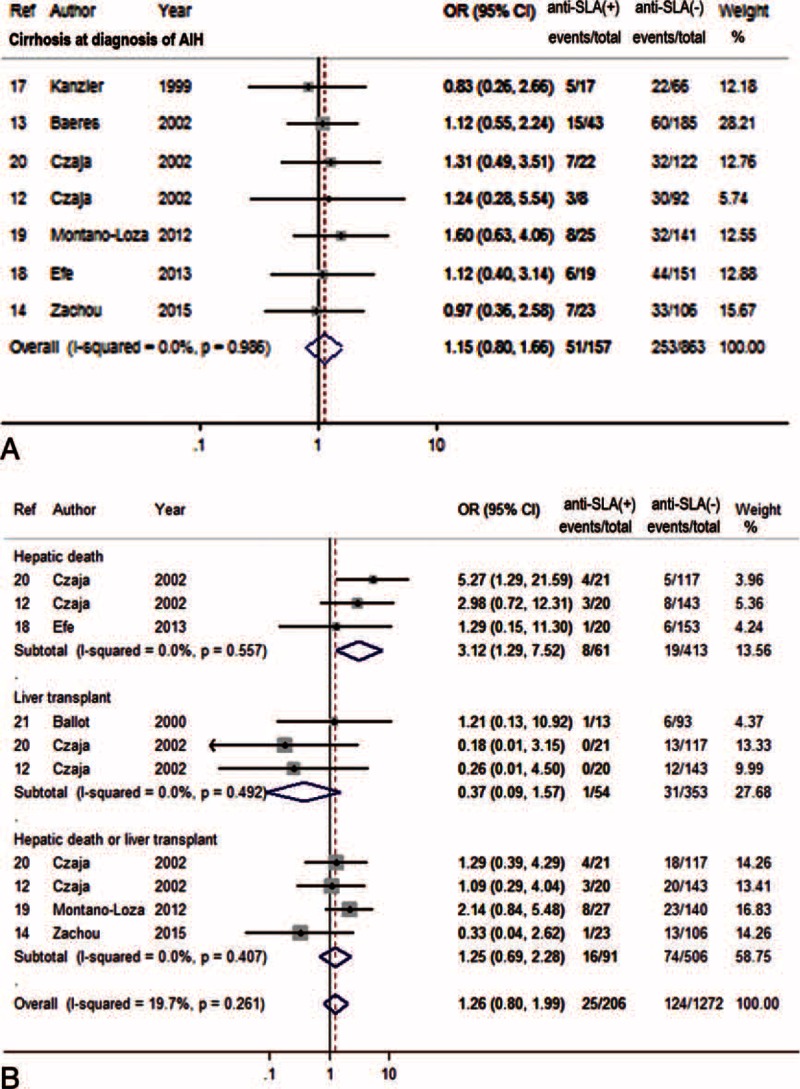
FIGURE 2.

Forest plots of prognostic outcome associations with anti-SLA. The pooled ORs and 95% CIs for risk of cirrhosis at diagnosis (A), or hepatic death and/or liver transplantation (B). CI = confidence interval, OR = odds ratio, SLA = soluble liver antigen.
