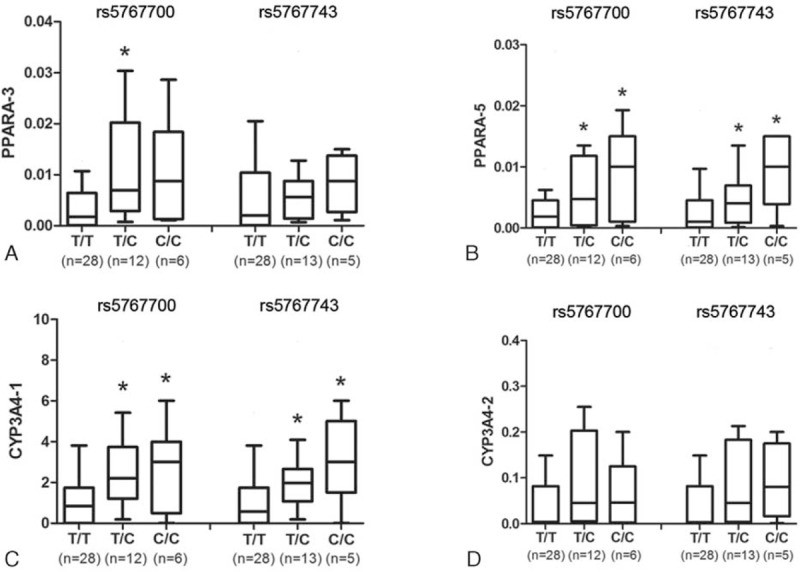
FIGURE 2.

Hepatic PPARα (Splice pattern: PPARα-3 [A] and PPARα-5 [B]) and CYP3A4 (Splice pattern: CYP3A4-1 [C] and CYP3A4-2 [D]) mRNA expressions differed among different genotypes of rs5767700 and rs5767743. ∗P < 0.05 versus the T/T genotype using Mann–Whitney U test with multiple test correction (Bonferroni). The data are showed as box-and-whisker plot.
