FIGURE 4.

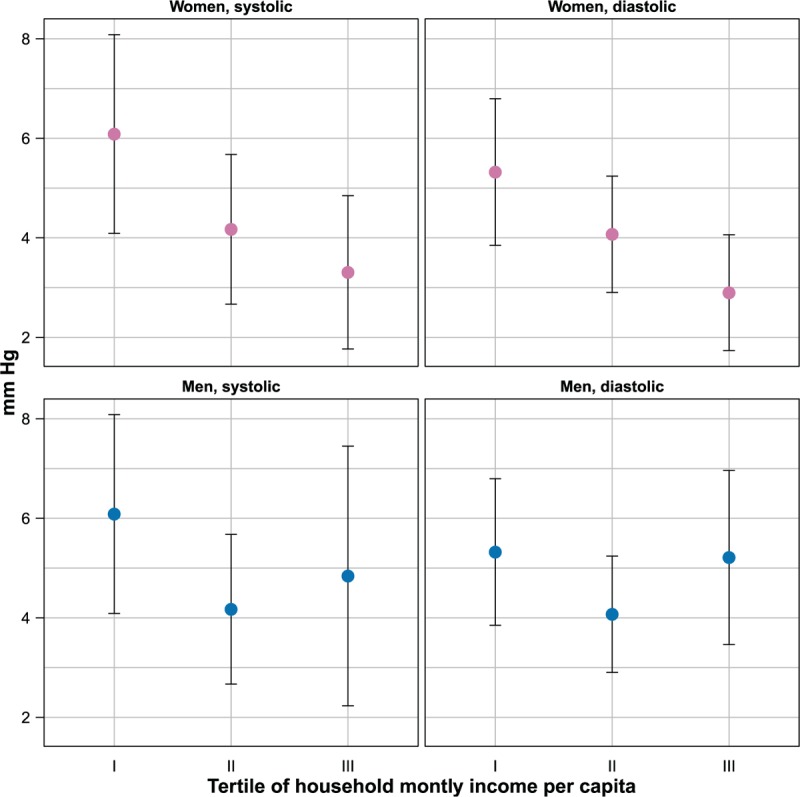
Magnitude of seasonal effect on blood pressure by household income per capita and gender (estimates and 95% confidence intervals). Estimates are adjusted for age, urban or rural place of residence, body mass index, and smoking status.

Magnitude of seasonal effect on blood pressure by household income per capita and gender (estimates and 95% confidence intervals). Estimates are adjusted for age, urban or rural place of residence, body mass index, and smoking status.