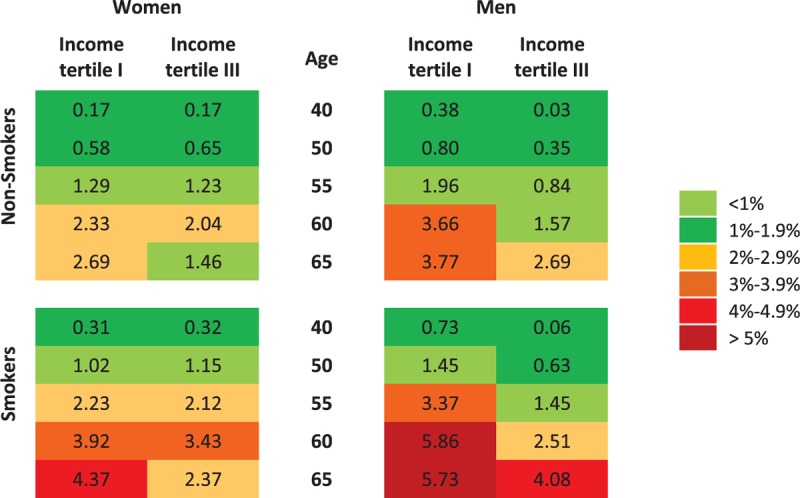
FIGURE 5.

Simulated effect of seasonal variation in blood pressure on 10-year cumulative risk of developing any major atherosclerotic cardiovascular event. The chart shows the absolute difference on 10-year risk of developing any major atherosclerotic cardiovascular event when the values of blood pressure vary according to the estimated seasonal effect, by gender, age, smoking status, and income tertile. Absolute risks are calculated as in D’Agostino et al.38 Body mass index is kept constant at the population average, by gender and age category. Other risk factors not explicitly shown in the chart (diabetes and antihypertensive treatment) are considered to be absent.
