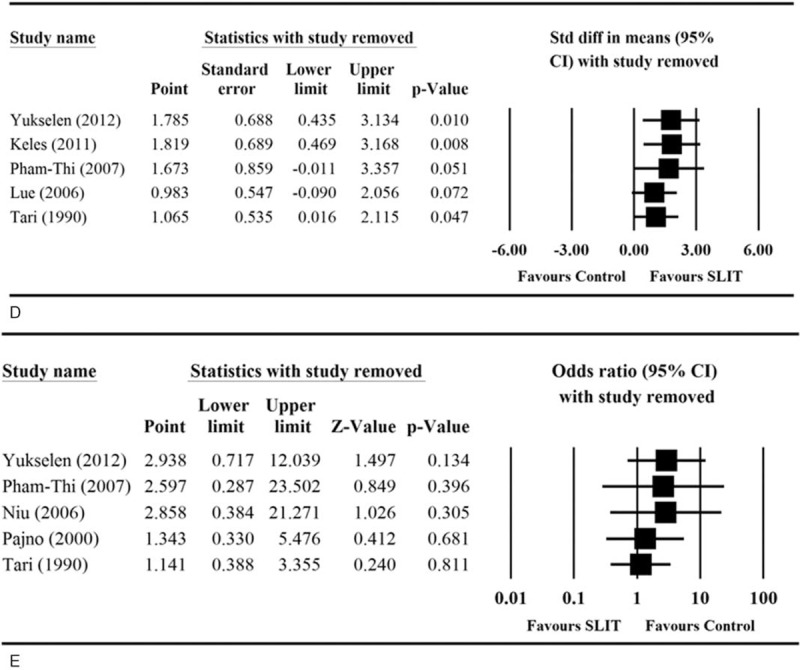
FIGURE 5 (Continued).

Sensitivity analyses of the comparisons of (A) asthma symptom score, (B) medication score, (C) specific Dermatophagoides pteronyssinus IgE levels, (D) sIgG4 levels, and (E) adverse event between two treatment groups. CI = confidence interval, IgE = immunoglobulin E, sIgG4 = serum immunoglobulin G4.
