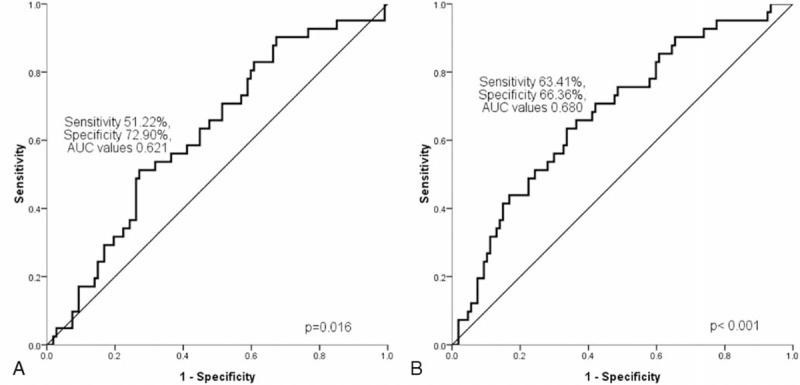
FIGURE 2.

(A) The discriminative cut-off value for the NLR was 4.35 (sensitivity 51.22% and specificity 72.90%; AUC values 0.621, 95% CI 0.538–0.699, P = 0.016); and (B) for the LMR was 2.11 (sensitivity 63.41% and specificity 66.36%; AUC values 0.680, 95% CI 0.598–0.754, P < 0.001). AUC = area under the curve, CI = confidence interval, LMR = lymphocyte/monocyte ratio, NLR = neutrophil/lymphocyte ratio.
