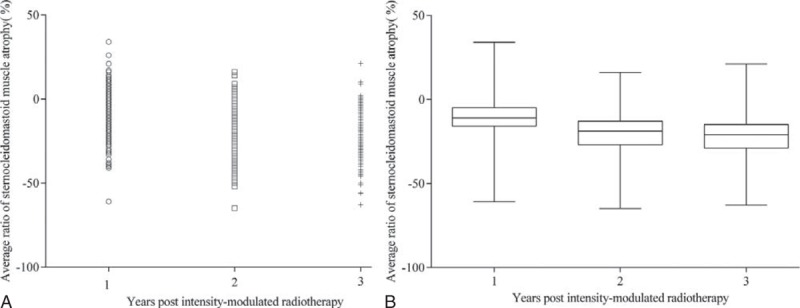
FIGURE 1.

Dot density plot (A) and box and whisker plot (B) depicting the evolution of intensity-modulated radiotherapy-induced sternocleidomastoid muscle atrophy ratio in 223 nasopharyngeal carcinoma patients during the 3 years following intensity-modulated radiotherapy. In plot (B), the boxes, horizontal lines located in the box, and whiskers represent the 25th to 75th percentiles, median values, and the maximum and minimum sternocleidomastoid muscle atrophy ratio, respectively.
