FIGURE 4.

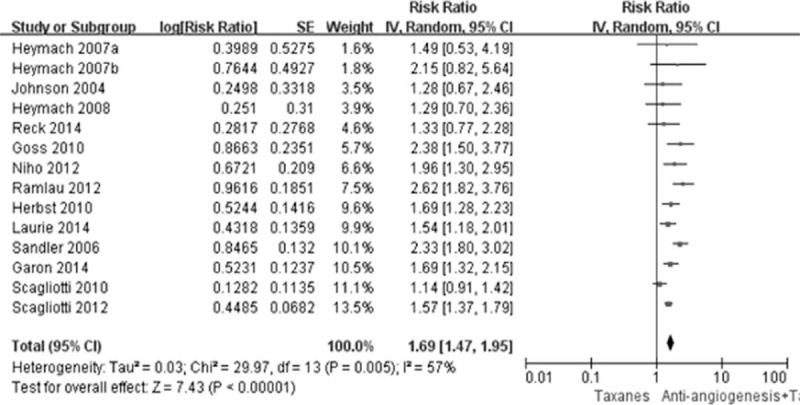
Forest plot and pooled RR and 95% CI for ORR: antiangionesis therapy plus TCC versus TCC alone. CI = confidence interval, ORR = objective response rate, RR = risk ratio, TCC = taxanes-containing chemotherapy.

Forest plot and pooled RR and 95% CI for ORR: antiangionesis therapy plus TCC versus TCC alone. CI = confidence interval, ORR = objective response rate, RR = risk ratio, TCC = taxanes-containing chemotherapy.