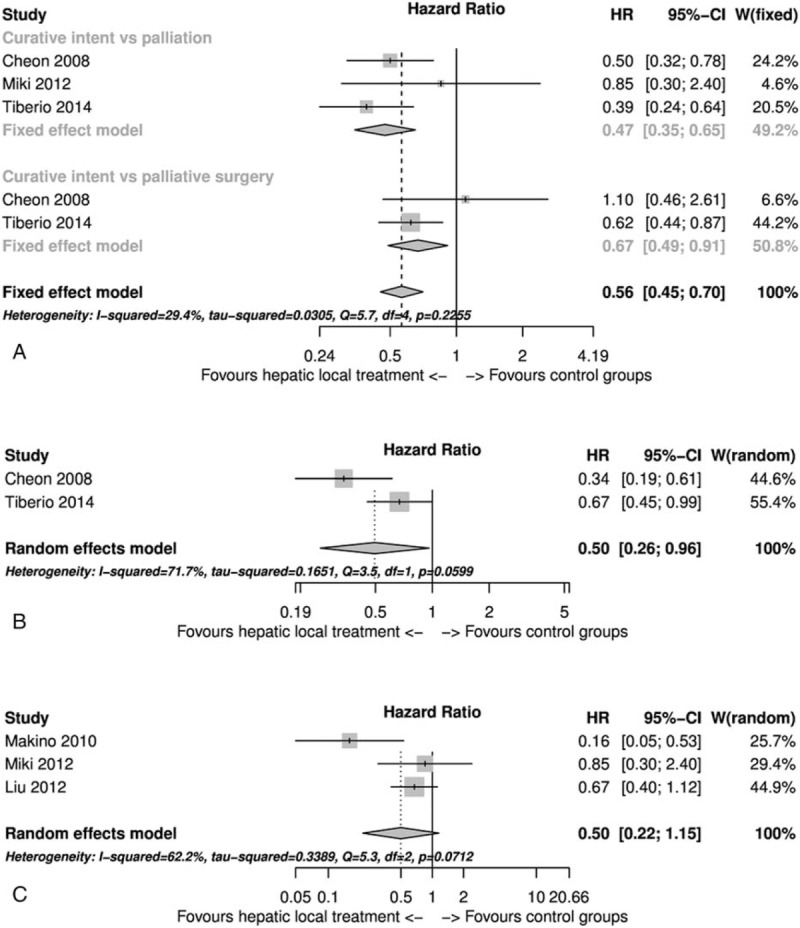
FIGURE 3.

Forest plots. (A) Curative surgery vs surgical or systematic palliation (this strata had no significant heterogeneity) and curative surgery vs palliative surgery with local hepatic treatment (this strata had no significant heterogeneity). (B) Palliative surgery with local hepatic treatment vs surgical or systematic palliation. (C) HR and 95% CI from multivariate analysis of curative surgery vs palliation. CI = confidence interval; HR = hazard ratio.
