
. 2015 Aug 7;94(31):e1266. doi: 10.1097/MD.0000000000001266
Copyright © 2015 Wolters Kluwer Health, Inc. All rights reserved.
This is an open access article distributed under the Creative Commons Attribution-NoDerivatives License 4.0, which allows for redistribution, commercial and non-commercial, as long as it is passed along unchanged and in whole, with credit to the author. http://creativecommons.org/licenses/by-nd/4.0
FIGURE 1.
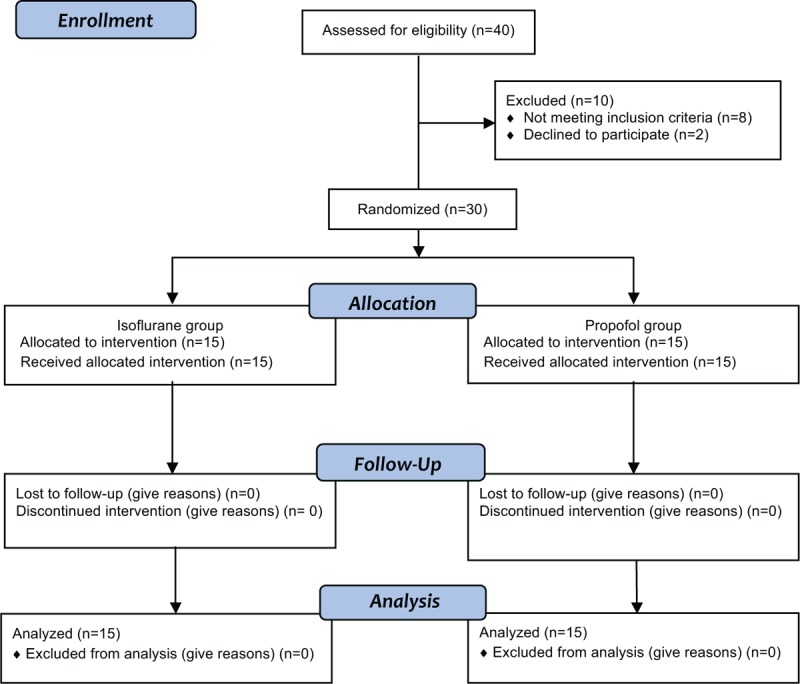
Flow diagram of the study.