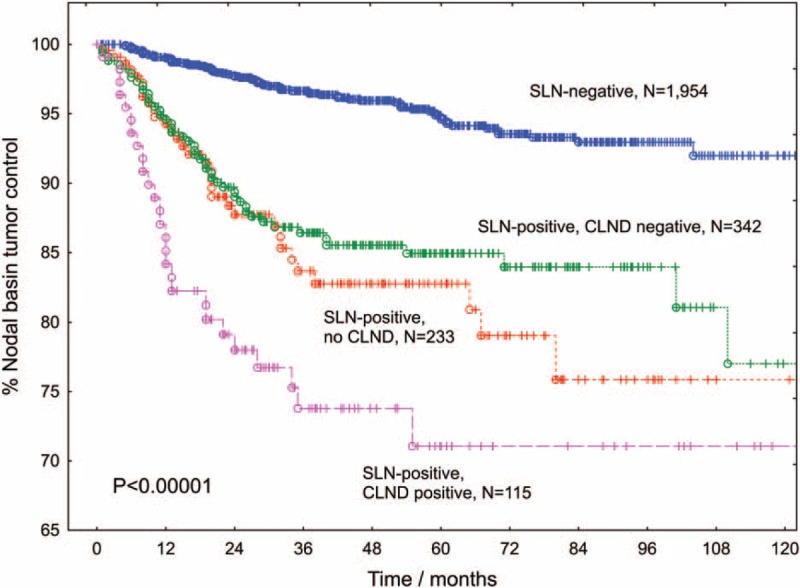
FIGURE 1.

Local control rates after SLN biopsy according to the type of lymph node surgery performed. The blue curve (including all 77 nodal recurrences in the same nodal basin after initially negative SLNB) depicts the “estimated negative predictive value of SLNB” >10 years. The green and the magenta curves demonstrate the probability of a tumor-free nodal basin in the SLN-positive subpopulations with pathologically negative or positive CLND, respectively. The SLN-positive patient group without CLND (red curve) is clearly biased, because it includes, on the one hand, patients who refused radical surgery, elderly patients or patients with increased general morbidity and, on the other hand, patients showing a relatively low nodal tumor burden. CLND = completion lymph node dissections, SLN = sentinel lymph node, SLNB = sentinel lymph node biopsy.
