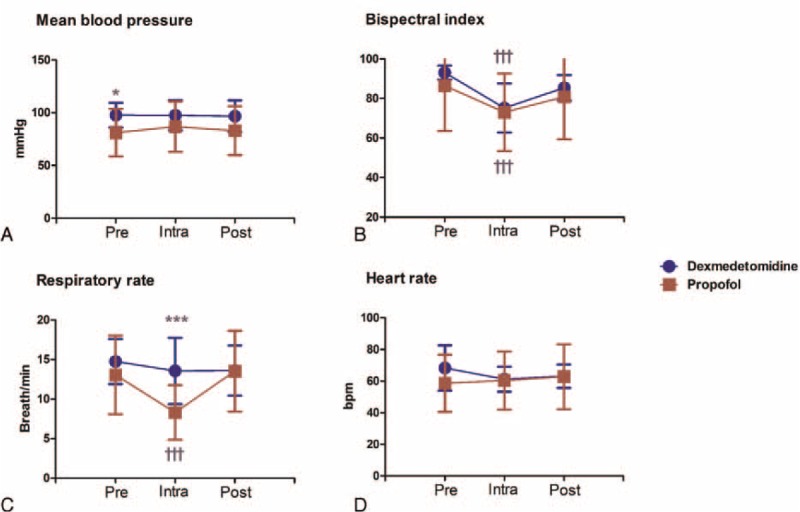
FIGURE 3.

Changes in vital signs and BIS values during radiofrequency ablation. Data are expressed as the mean ± SD during radiofrequency ablation of hepatic neoplasm. ∗P < 0.05 and ∗∗∗P < 0.001 when compared between groups. †††P < 0.001 compared with preprocedure. BIS = bispectral index, Intra = intraprocedure, Post = postprocedure, Pre = preprocedure.
