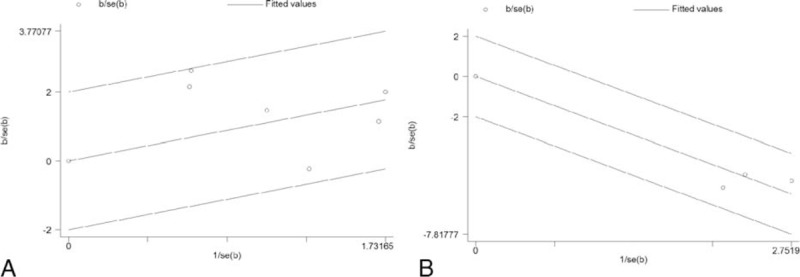
FIGURE 2.

Galbr figure of included studies focusing on the correlation between tenascin (TN) and WHO grade. (A) is for 6 studies with dichotomous data, and (B) is for 3 studies with continuous data. If the circles are all distributed within the region bounded by the upper line and the lower line, it can be taken as an evidence of homogeneity. The farther from the region, the more obvious the heterogeneity is.
