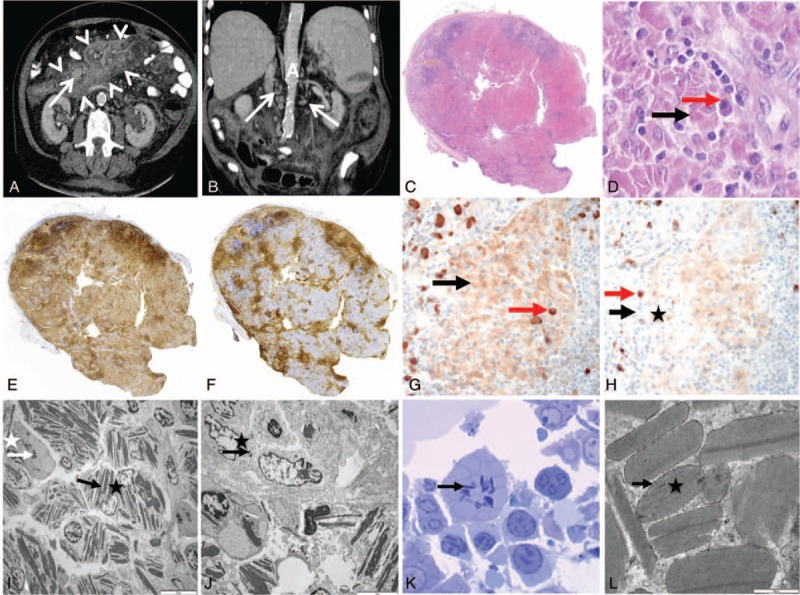
FIGURE 1.

Computed tomography (CT) scan of the abdomen (A, B), lymph node (C–J), and bone marrow biopsy (K, L). (A) Axial view upon iode injection, showing mesenteric fat tissue hyperdensity (arrow heads) and mesenteric lymph node enlargement (arrow). (B) Coronal view upon iode injection showing multiple paraaortic lymph nodes (arrows). A = aorta. (C) General view of the lymph node (hematoxylin–eosin staining, original magnification ×25). Lymph node parenchyma is replaced with large sheets of pink cells corresponding to infiltrating macrophages. Few follicules persist on boundaries. (D) Pink area in lymph node (hematoxylin–eosin staining, original magnification ×400). Pink cells correspond to macrophages filled with crystals (black arrow). They are associated with some plasma cells (red arrow). (E) Immunoperoxidase anti-CD3 staining (original magnification ×25). (F) Immunoperoxidase anti-CD20 staining (×25). Normal T and B territories persist on boundaries of the lymph node and between the sheets of macrophages. (G) Immunoperoxidase anti-κ staining (×400). (H) Immunoperoxidase anti-λ staining (×400). There is a polyclonal staining pattern of plasma cells (red arrows), and crystals were predominantly stained with κ-antibody (black arrows). (I) Lymph node analysis on electron microscopy (×2000). Macrophage (black star) and some plama cell (white star) contain crystals (white and black arrows) in their cytoplasm. (J) Lymph node analysis on electron microscopy (×5000). Some crystals (black arrow) were found in endothelial cell (black star). (K) Bone marrow on electron microscopy (toluidine blue, ×1000). Some plasma cells contain crystals (arrow) in their cytoplasm. (L) Crystal analysis on electron microscopy (×50,000). Crystal (star) does not have periodicity and is lined by an endocytosis membrane (arrow).
