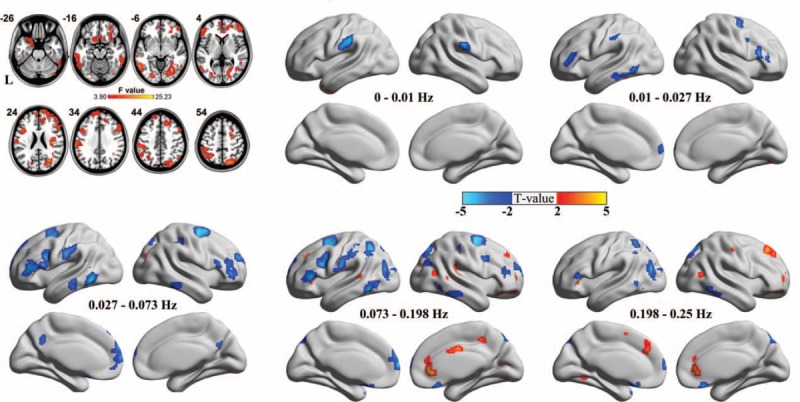
FIGURE 2.

Group main effects and between-group comparison of local frequency-specific synchronization. A 2-way repeated-measure analysis of variance (P < 0.05, corrected) revealed brain regions for which there was a main effect of group on local synchronization (axial maps). The number at the top of each axial image indicates the z coordinate of Montreal Neurological Institute space. L denotes the left hemispheres. Voxelwise post hoc 2-sample t tests (false discovery rate-corrected height threshold P < 0.05, and extent threshold k > 20 voxels) revealed brain regions with between-group differences in local synchronization at each frequency band (inflated surface maps). The warm and cold colors indicate the brain regions with significantly increased and decreased local synchronization, respectively.
