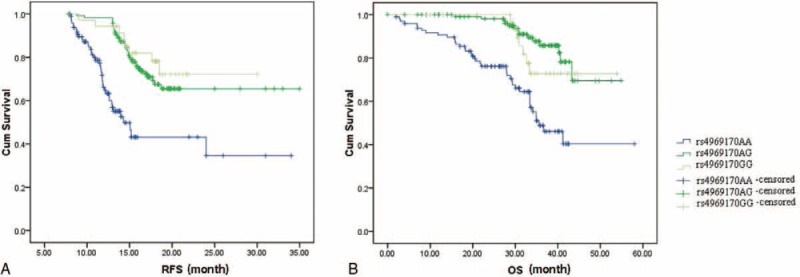
FIGURE 3.

The Kaplan–Miere curves for RFS and OS of HCC patients stratified by rs4969170GG genotypes. A, The mean RFS of patients with the rs4969170AA, AG, and GG genotypes were 18.2 ± 3.6, 17.6 ± 5.2, and 11.7 ± 3.8 months, respectively (log-rank test: P = 0.0002). B, The mean OS of patients with the rs4969170AA, AG, and GG genotypes were 36.8 ± 8.2, 35.2 ± 4.8, and 24.5 ± 5.6 months, respectively (log-rank test: P < 0.001).
