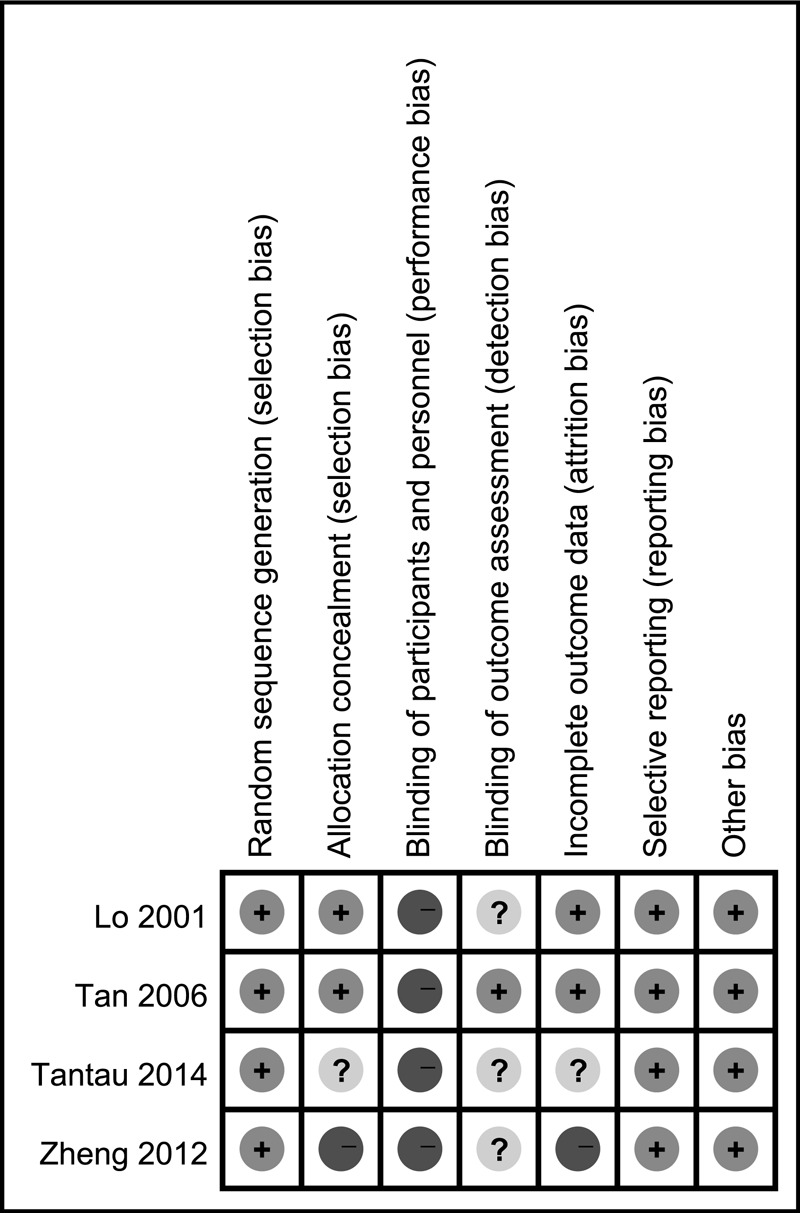
FIGURE 2.

Risk of bias summary: authors’ judgments about each risk of bias item for each included study. Green circles with +, low risk of bias; Yellow circles with ?, unclear risk of bias; Red circles with −, high risk of bias.

Risk of bias summary: authors’ judgments about each risk of bias item for each included study. Green circles with +, low risk of bias; Yellow circles with ?, unclear risk of bias; Red circles with −, high risk of bias.