FIGURE 2.

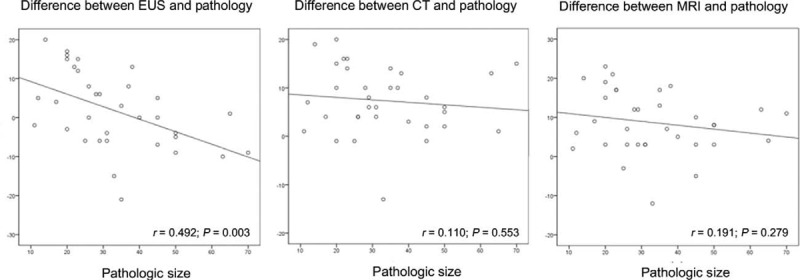
Linear regression analysis between pathologic size and the difference of size estimates from pathologic size. (A) By EUS, (B) CT, (C) MRI. CT = computed tomography, EUS = endoscopic ultrasonography, MRI = magnetic resonance image.

Linear regression analysis between pathologic size and the difference of size estimates from pathologic size. (A) By EUS, (B) CT, (C) MRI. CT = computed tomography, EUS = endoscopic ultrasonography, MRI = magnetic resonance image.