FIGURE 7.

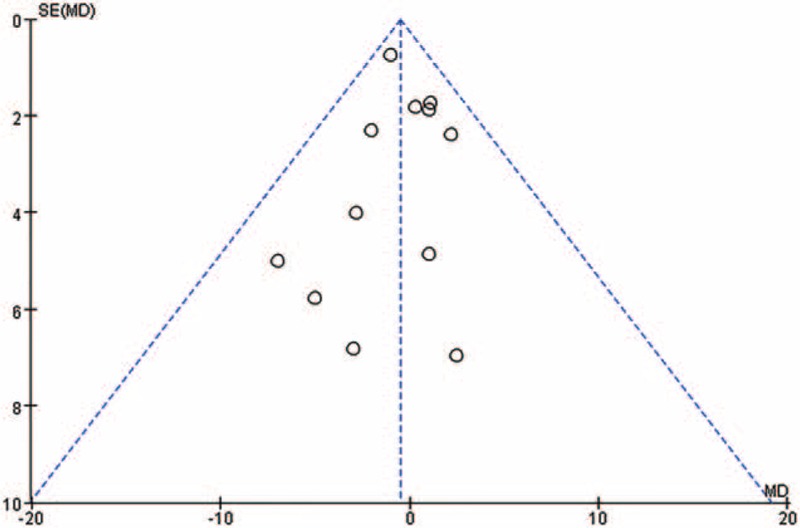
Funnel plot of the systolic blood pressure of 12 trials selected from all the 17 trials shows no significant evidence of asymmetry. MD = mean difference.

Funnel plot of the systolic blood pressure of 12 trials selected from all the 17 trials shows no significant evidence of asymmetry. MD = mean difference.