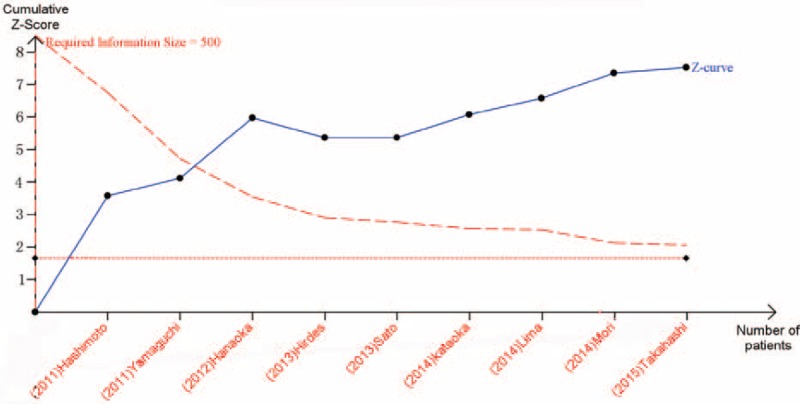
FIGURE 6.

TSA result showed that the Z-curve crossed the monitoring boundaries constructed from the information size calculation to ensure a maximum type I error of 1% and a maximum type II error of 10% for the stricture rate. TSA = trial sequence analysis.
