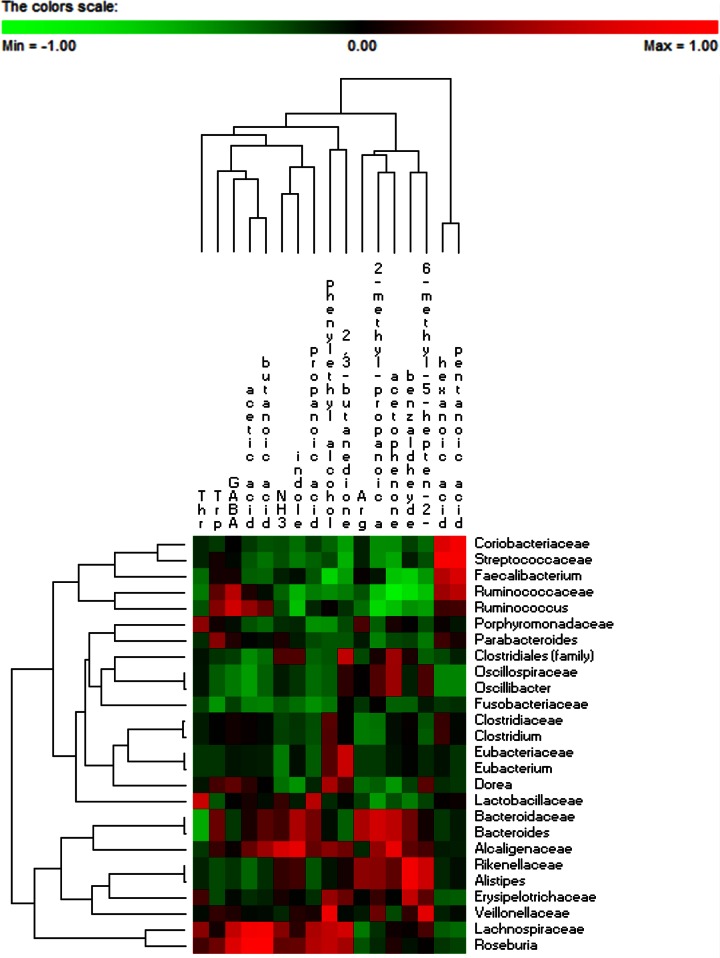
FIG 6.
Significant correlations between metabolically active bacterial OTUs (family and genus levels) and free amino acids and volatile organic compounds after 2 months of diet intervention with durum wheat flour and whole-grain barley pasta. The colors of the scale bar denote the nature of the correlation, with 1 indicating a perfectly positive correlation (red) and −1 indicating a perfectly negative correlation (green) between two microbial families or genera. Only significant correlations (FDR, <0.05) are shown. GABA, γ-aminobutyric acid.

