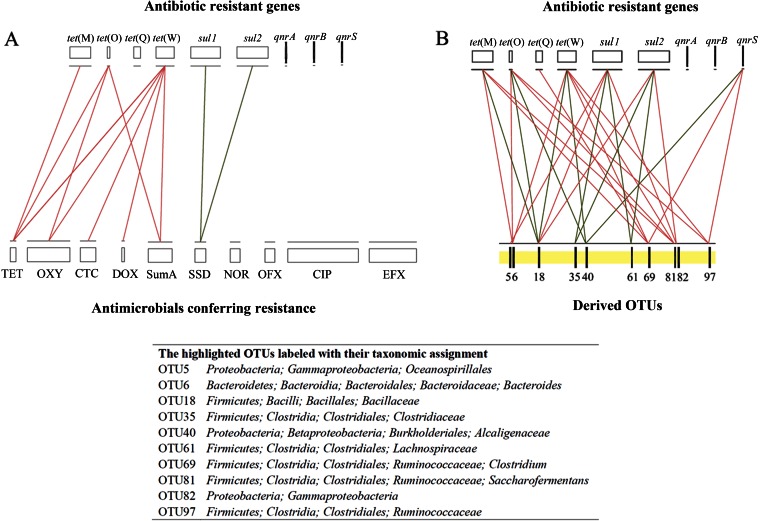
FIG 5.
Network analyses as inferred by pairwise Spearman correlations between antibiotic resistance genes and antimicrobials (A) and antibiotic resistance genes and normalized OTU abundances (B). The normalized reads in each OTU are calculated by the percentage of reads in each OTU for each sample multiplied by the means of the total reads in all samples studied. In order to filter the data for reduced network complexity, the connections (red lines for positive and green lines for negative) shown here stand only for strong (Spearman's r of >0.7) and remarkably significant (P < 0.01) correlations. The most abundant and significantly changed top 100 OTUs were used for network analysis (see Table 1 for details), and the top 10 with the most correlations with antibiotic resistance genes are highlighted and labeled with their taxonomic assignments. The background values of the ARG abundances and antimicrobial concentrations detected in fresh manure are illustrated by the lengths of the bars. SumA, the total abundance of four tetracyclines.

