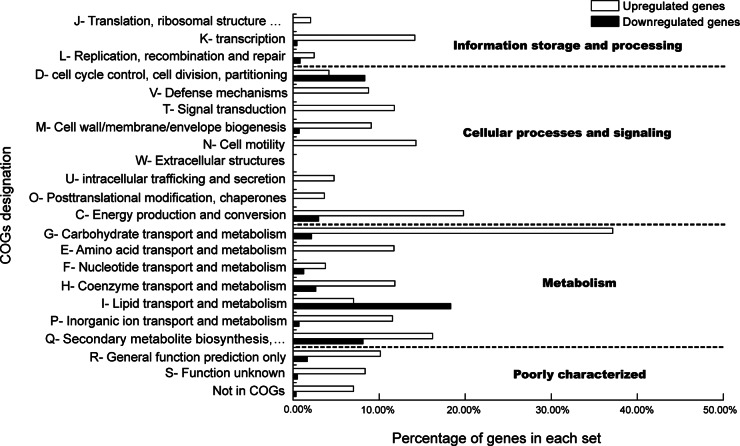
FIG 2.
Functional classification according to COGs of genes differentially expressed by L. plantarum ST-III grown in the presence of FOS versus glucose. The profile of each functional classes is shown as the percentage of all genes in the class whose expression was significantly upregulated (open bars) or downregulated (filled bars).

