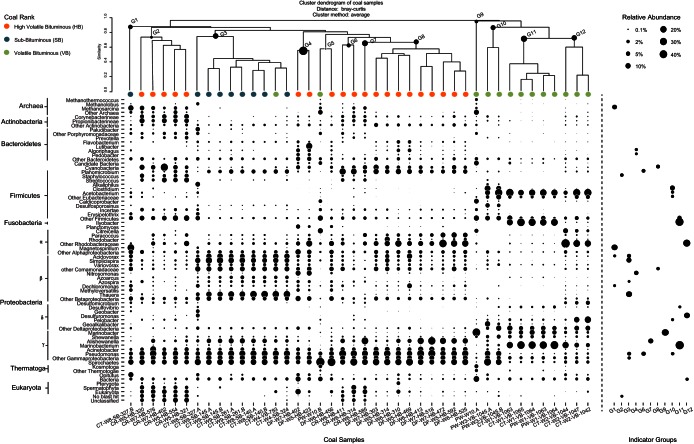
FIG 2.
Microbial community structure and indicator taxa for each coalbed sample and indicator group. Bubble size indicates the relative abundance of abundant taxa. The cluster dendrogram (top) was generated using the average-linkage method and Bray-Curtis dissimilarity. Colored bubbles denote sample coal rank. G, group.

