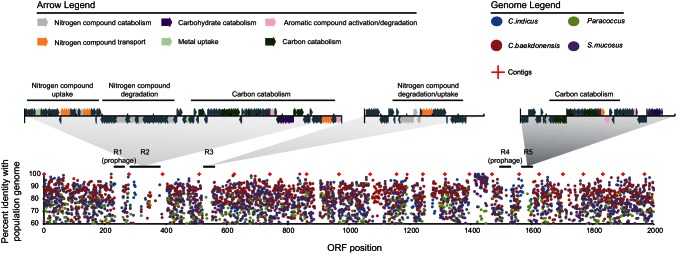
FIG 6.
Fine-scale comparisons of Paracoccus sp. N5, S. mucosus, C. baekdonensis N30, and bin 1 (Celeribacter sp.) genomes. The x axis indicates the ORF position in the bin 1 population genome (by ORF number); the y axis indicates the percent amino acid similarity of isolate genomes with the bin 1 population genome as determined by best reciprocal BLASTP hits. Arrows indicate predict ORFs identified within variable genomic regions. ORF annotations for each variable region (R) can be found in File S3 in the supplemental material.

