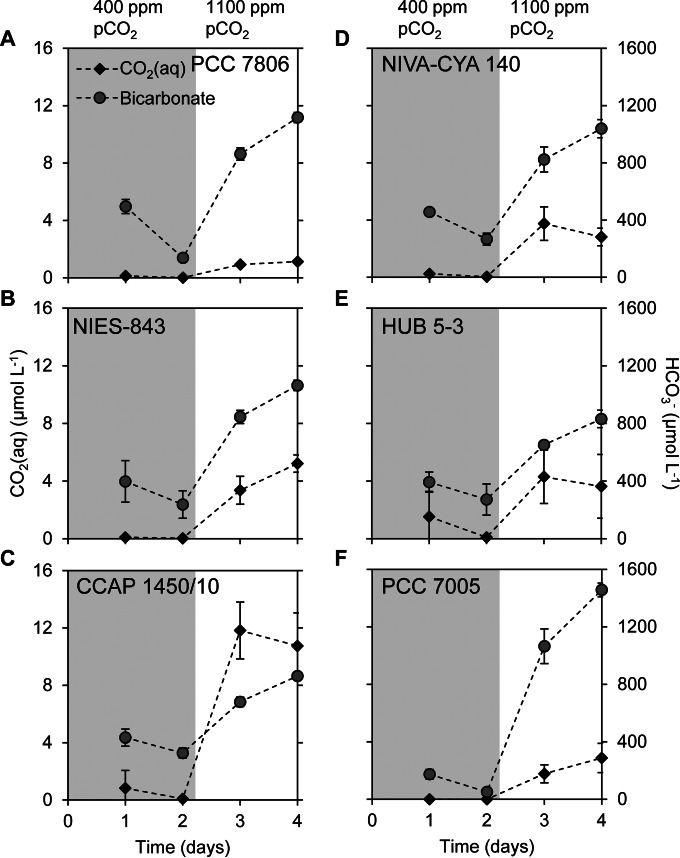
FIG 3.
Dissolved CO2 and bicarbonate concentration during the exponential phase in batch cultures of six Microcystis strains. (A) PCC 7806; (B) NIES-843; (C) CCAP 1450/10; (D) NIVA-CYA 140; (E) HUB 5-3; (F) PCC 7005. The batch cultures were exposed to 400 ppm of pCO2 in the gas flow for 2 days (shaded area), and thereafter the pCO2 concentration was increased to 1,100 ppm (unshaded area). The mineral medium contained 10 mmol liter−1 sodium ions. Error bars indicate the standard deviations (n = 4 biological replicates).

