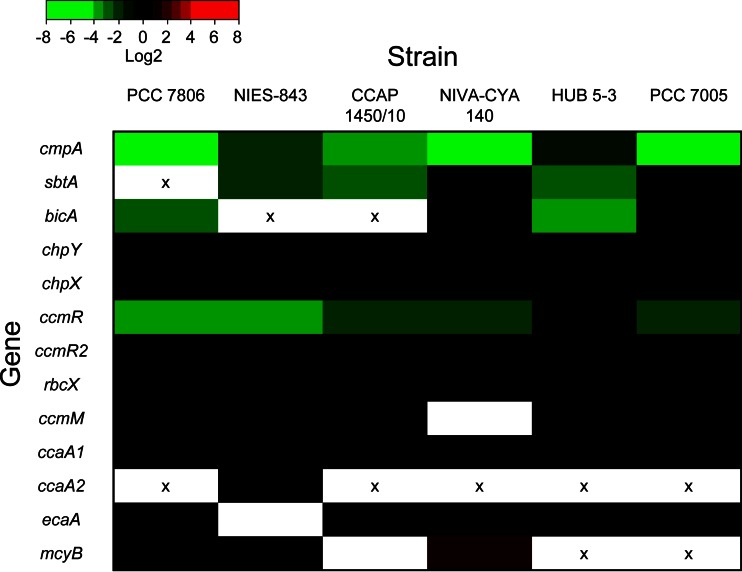
FIG 4.
Heat map of changes in gene expression at elevated CO2 for each of the six Microcystis strains. Gene expression changes were obtained by RT-qPCR applied to samples taken before and 20 h after increasing the pCO2 level from 400 to 1,100 ppm. The color bar indicates log2 values. Significant downregulated genes are shown in green, significant upregulated genes are shown in red, and nonsignificant changes (P > 0.05) or log2 values between −0.8 and 0.8 are shown in black. Genes not measured are shown in white and genes absent in strains are marked with an “x”. Detailed RT-qPCR results are presented in Table S2 in the supplemental material.

