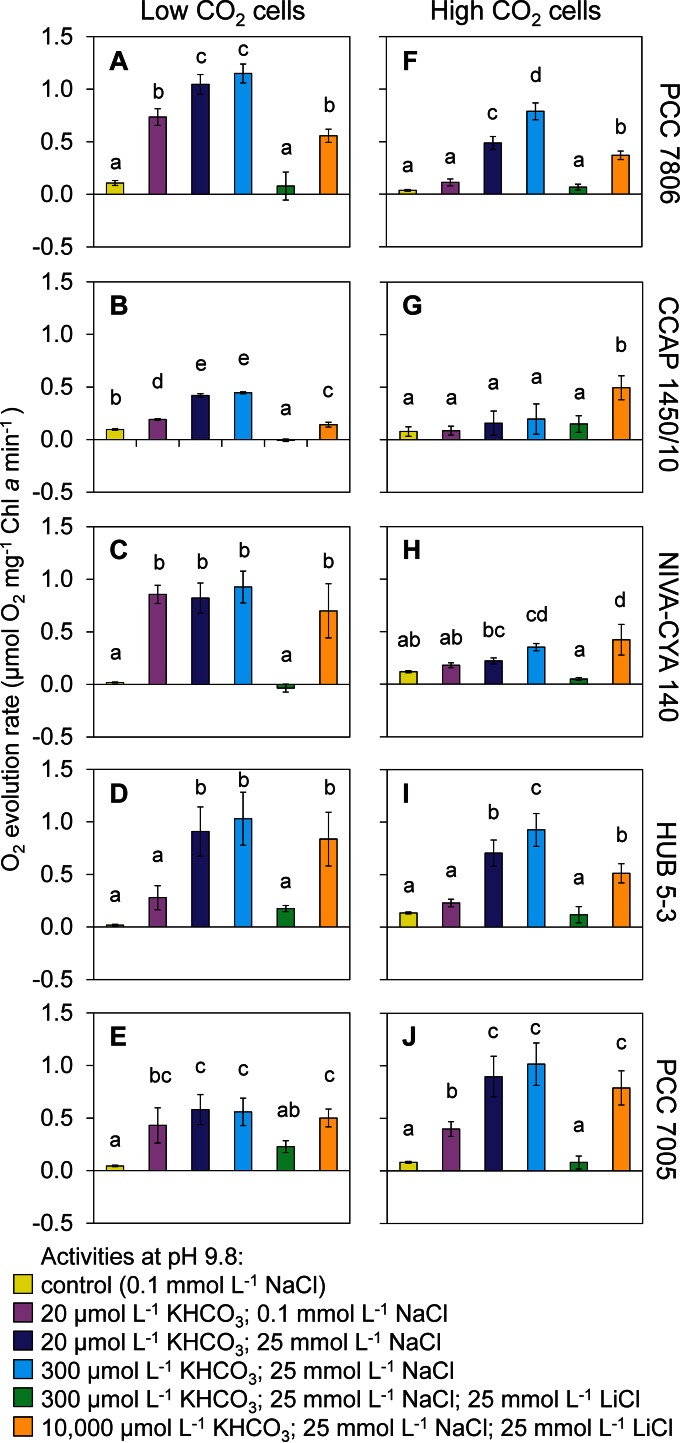
FIG 5.
Activity of Ci uptake systems of five Microcystis strains, inferred from O2 evolution. The strains were acclimated to either low CO2 levels (A to E) or high CO2 levels (F to J). O2 evolution was measured after addition of different concentrations of KHCO3, NaCl, and LiCl to induce or block the activity of specific Ci uptake systems, as indicated in Table 1. Error bars indicate standard deviations (n = 4 biological replicates per treatment). Different letters above the bars indicate significant differences between the treatments, as tested by one-way analysis of variance with post hoc comparison of the means based on Tukey's HSD test (α = 0.05).

