
FIGURE 2.
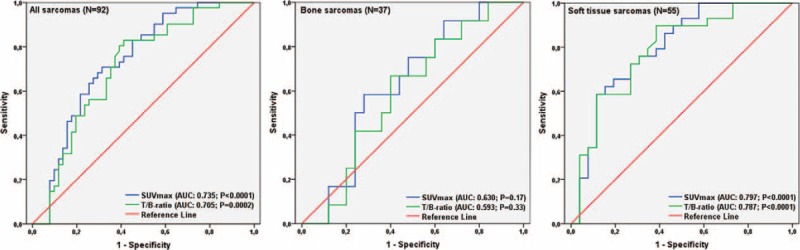
ROC curve analysis of all included patients (N = 92) and subgroups of patients with BS (N = 37) or STS (N = 55), with measurements of the accuracy of SUVmax of the primary tumor and T/B uptake ratio as prognostic variables. BS = bone sarcoma; ROC = receiver operating characteristic; STS = soft tissue sarcoma; SUVmax = maximum standardized uptake value.