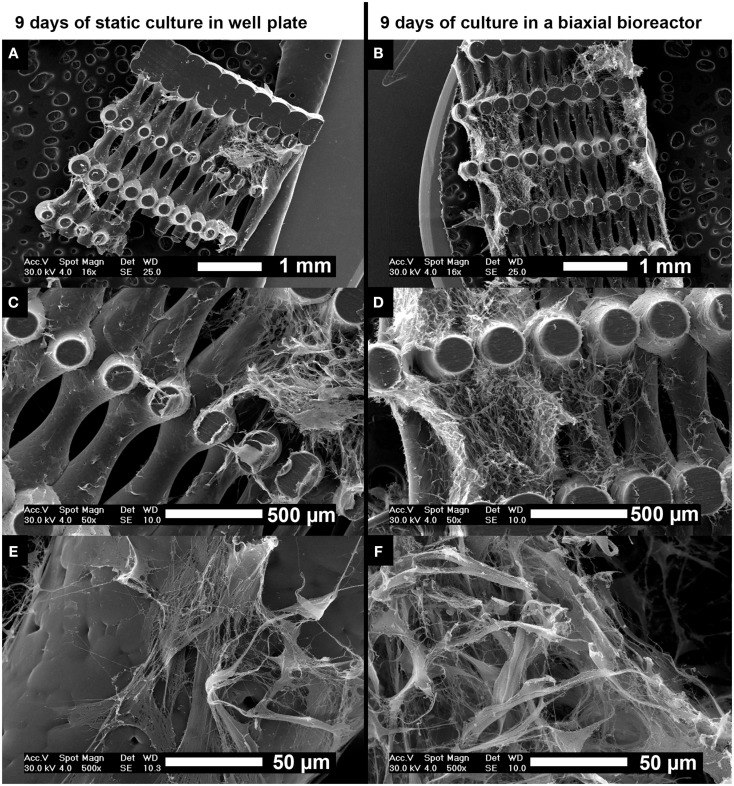
Figure 4.
Scanning electron microscopy images of the distribution of hfMSCs throughout the scaffolds after 9 days of static culture in a well plate (A,C,E) and after 3 days of static followed by 6 days of dynamic culture in a biaxial rotating bioreactor (B,D,F). A slightly more homogeneous distribution of cells and ECM was found after culture in the biaxial bioreactor compared to static culture in a well plate. Scale bars represent (A,B) 1 mm, (C,D) 500 μm, and (E,F) 50 μm.

