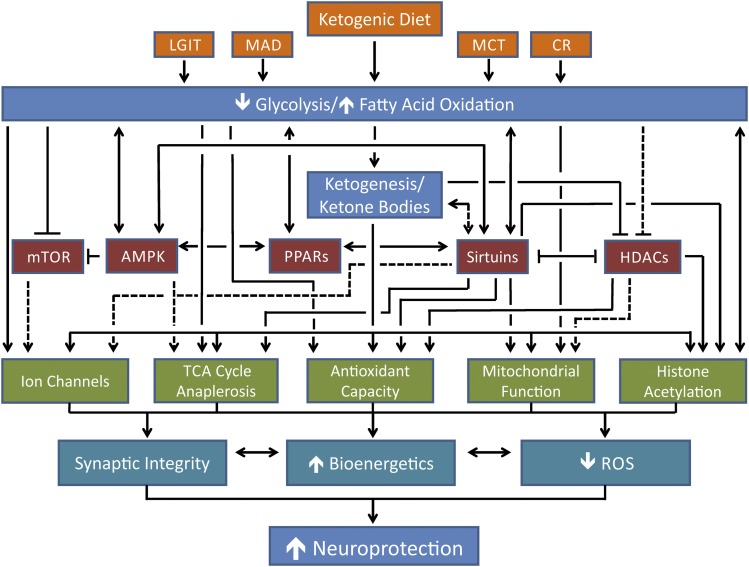
Fig. 4.
Proposed mechanisms for the neuroprotective effects of the KD and its variants. The dietary interventions are shown in orange; the metabolic effects of the diets are shown in blue; the energy-sensing pathways that may mediate the effects of the dietary alterations are shown in red; the cellular effects resulting from the diets and/or the energy-sensing pathways are shown in green; and the broad protective effects of the diets and the resulting cellular effects are in shown cyan. Solid black lines indicate links proven in the literature; dashed black lines represent possible, but as yet unproven, links. Further details are provided in the text.

