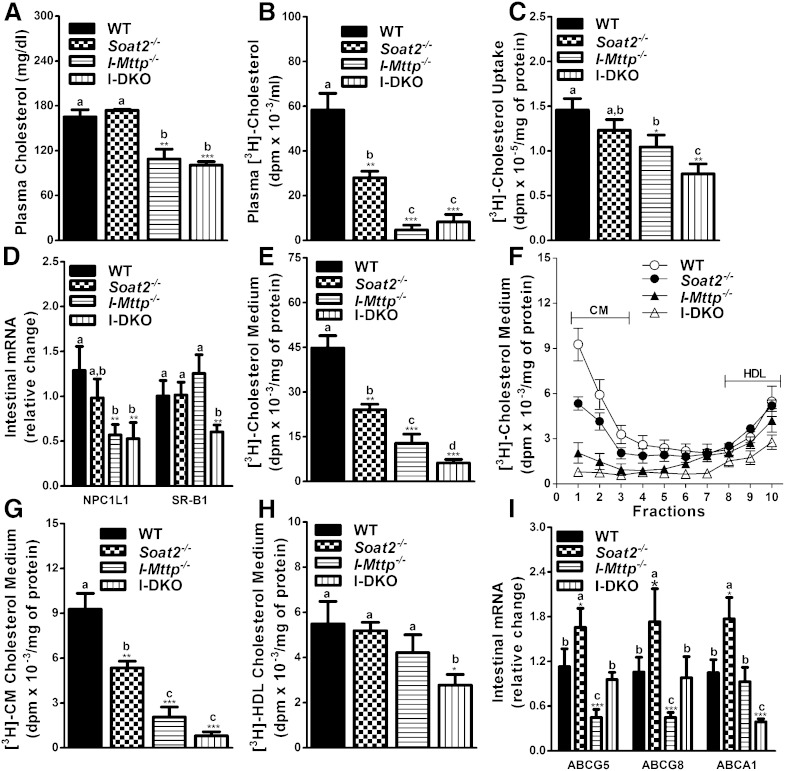
Fig. 3.
Global ACAT2 and intestine-specific MTP gene deletion decreases absorption and secretion of cholesterol. Twelve-week-old WT, Soat2−/−, I-Mttp−/−, and I-DKO male mice (n = 3) were fasted overnight and injected intraperitoneally with P407 (30 mg/mouse). After 1 h, mice were gavaged with 0.5 μCi of [3H]cholesterol as well as 0.2 mg of cholesterol in 15 μl of olive oil. Plasma was collected after 2 h to measure cholesterol mass (A). Total plasma was also used to measure total radioactivity to determine the absorption of [3H]cholesterol (B). To study cholesterol uptake, enterocytes were isolated from twelve-week-old chow diet-fed overnight-fasted mice and incubated with 0.5 μCi/ml of [3H]cholesterol. After 1 h, enterocytes were washed and lipids were isolated to determine uptake of radiolabeled cholesterol (C). Total RNA isolated from the intestine, as described in Fig. 1, was used to quantify mRNA levels of NPC1L1 and SR-B1 (D). For characterization of secreted lipoproteins, after 1 h of uptake, enterocytes were washed and incubated with fresh media containing 1.4 mM oleic acid containing micelles for 2 h. Isolated lipids from the media (E) were counted to determine total cholesterol radioactivity. [3H]cholesterol radiolabeled media were used for separating lipoproteins by density gradient ultracentrifugation and radioactivity was determined in each fraction (F). Fractions 1–3 and 8–10 represent chylomicrons (CM) and HDLs, respectively. For better representation of CMs (G) and HDLs (H), fractions 1 and 10 from (F), respectively, were plotted separately. Total RNA isolated from the intestine of 12-week-old WT, Soat2−/−, I-Mttp−/−, and I-DKO (n = 5) male mice fed a chow diet was used to quantify mRNA levels of different cholesterol absorption (I). Each measurement was done in triplicate with three mice per group. Data in (C) and (E–H) were normalized to cellular protein and are representative of two separate experiments. Data are presented as mean ± SD. *P < 0.05, **P < 0.01, and ***P < 0.001 compared with WT as determined by Student’s t-test. Statistically significant differences in different parameters in the four groups were evaluated by one-way ANOVA with Newman-Keuls multiple comparison test. Different letters above bars indicate statistically significant differences (P < 0.05) as determined by one-way ANOVA.

